
Last updated Oct 14, 2022
The ubiquitous, over-used, and frequently derided spreadsheet came into existence for a simple purpose, for “keeping track of everything in a complicated world,” as Tim Harford explains for Financial Times. The earliest version of the spreadsheet was a paper-based double-entry bookkeeping system. Several hundred years later, an innovative student envisioned the ledgers of “spreadsheets” in digital form.
The spreadsheet as we know it was born.
The problem is that the spreadsheet hasn’t changed much since its birth. The rest of the world, meanwhile, has changed. Dramatically. The basic structure of a spreadsheet — information arrayed in a sortable table — is still extremely useful. But spreadsheets fall short in ways that are essential for how we work today: remote collaboration, up-to-the-minute version control, time-based sorting, change tracking, notifications, task assignments, status updates, prioritization, and more.
That’s why we’re pretty excited about the potential of Table view.
Could Table view replace your spreadsheets?
Table view has a powerful combination of features that fill a long-running gap: the ability to work with time-based information (i.e. events and tasks on a calendar) easily in a spreadsheet-like view.
Instead of dragging data from spreadsheet to calendar, you can see info in a calendar grid, then 🖱click! it’s in a sortable table. You’ll be able to work with data in a way calendars don’t usually allow: view and sort calendar fields in columns, plus let your calendar calculate for you.
Let’s take a look at some scenarios with Table view in action.
Scenario 1: Sort by status for content production
Content teams live by the calendar, but they need to sort data by more than the assigned due date. With Teamup, you can use custom fields to track status and context for each piece of content moving through production. Hang out in a long-term calendar view for content planning, then move to Table view for day-to-day content production, where you can quickly see what’s in progress, what’s in review, and what’s ready to move forward:
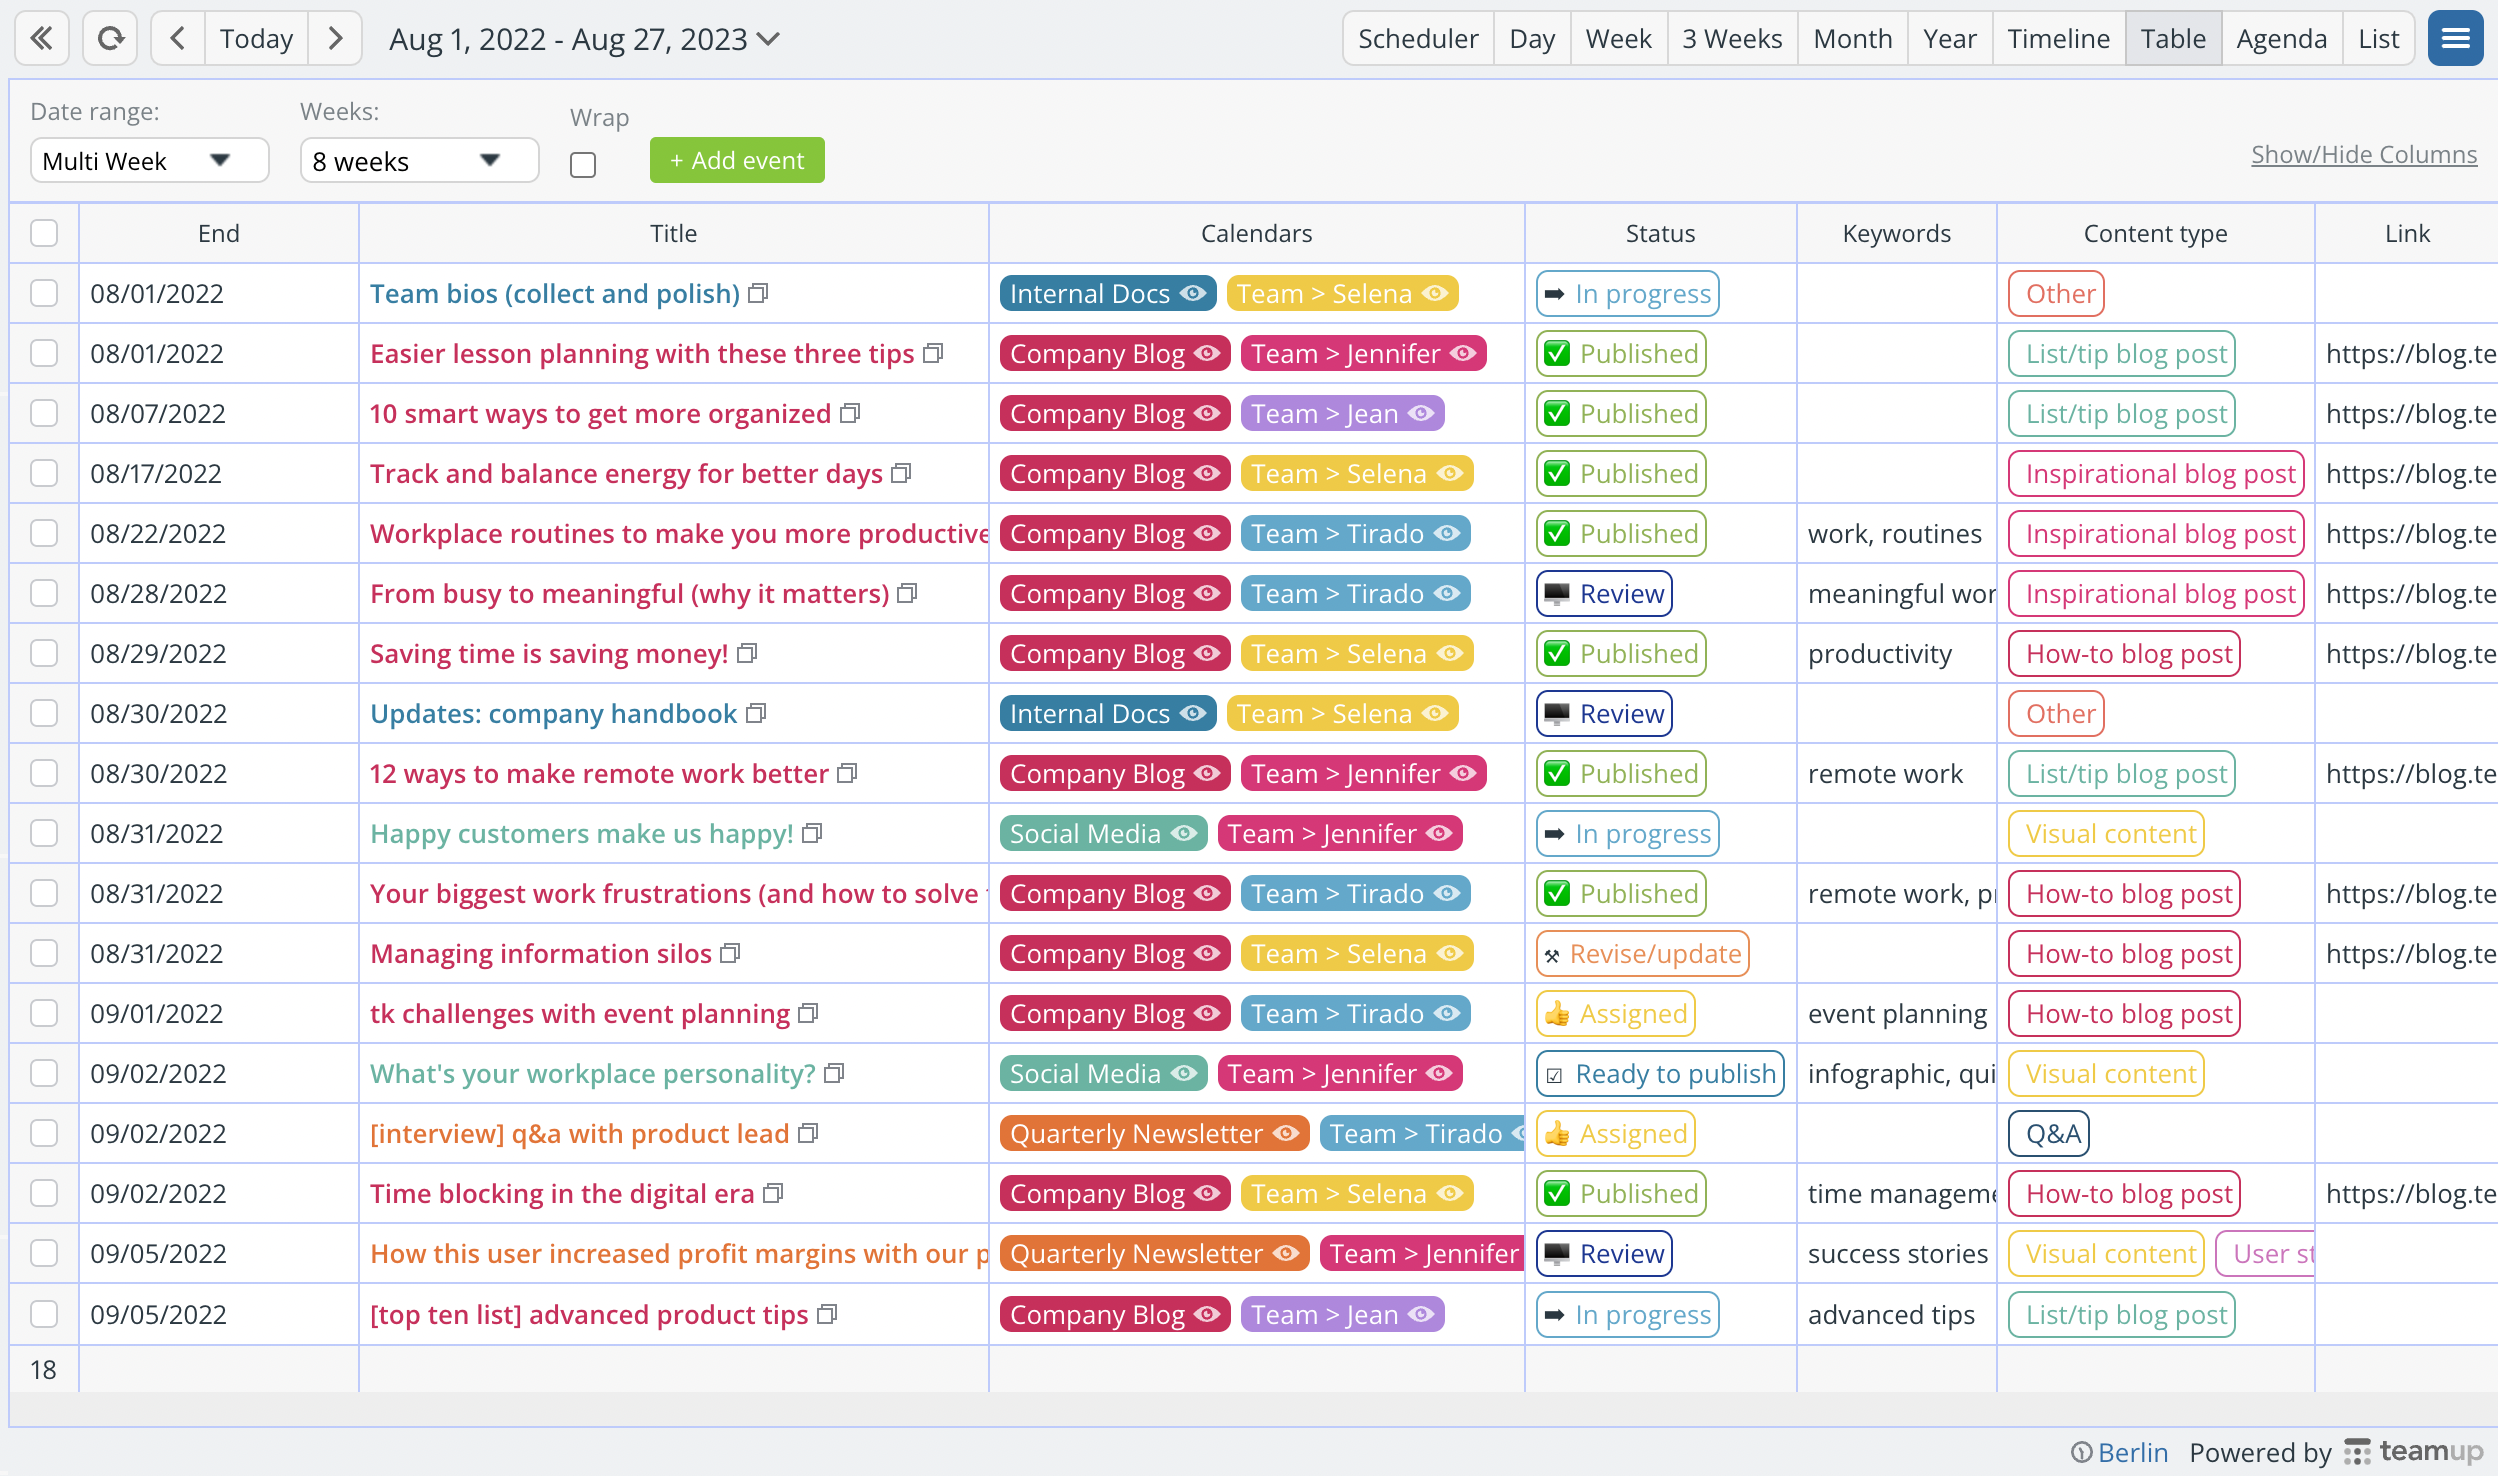
Let’s say your team handles content production for the company blog, the quarterly newsletter, internal docs, and social media. You need to choose which blog posts to highlight in the next newsletter, so you hide everything but blog posts and filter for Published status:
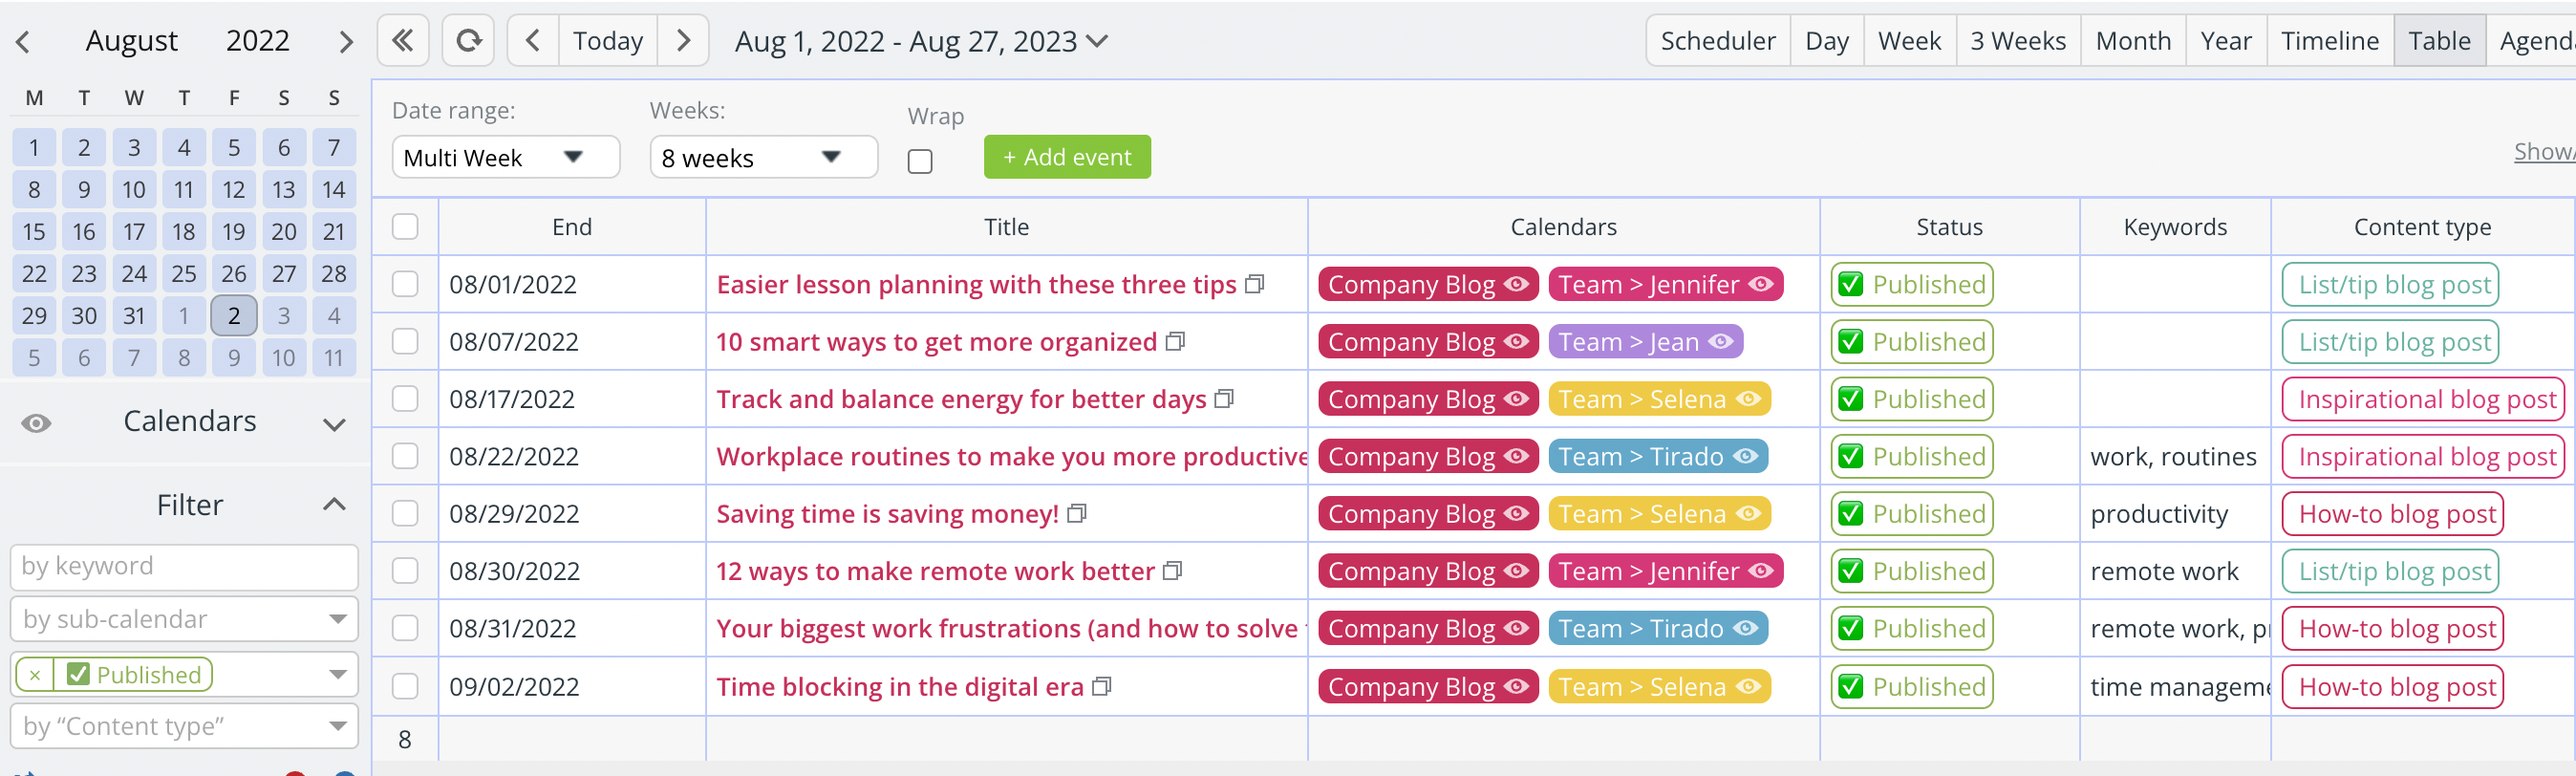
With the date range adjusted to show only posts published since the last newsletter was sent, you can quickly see all your options and choose the ones that work best.
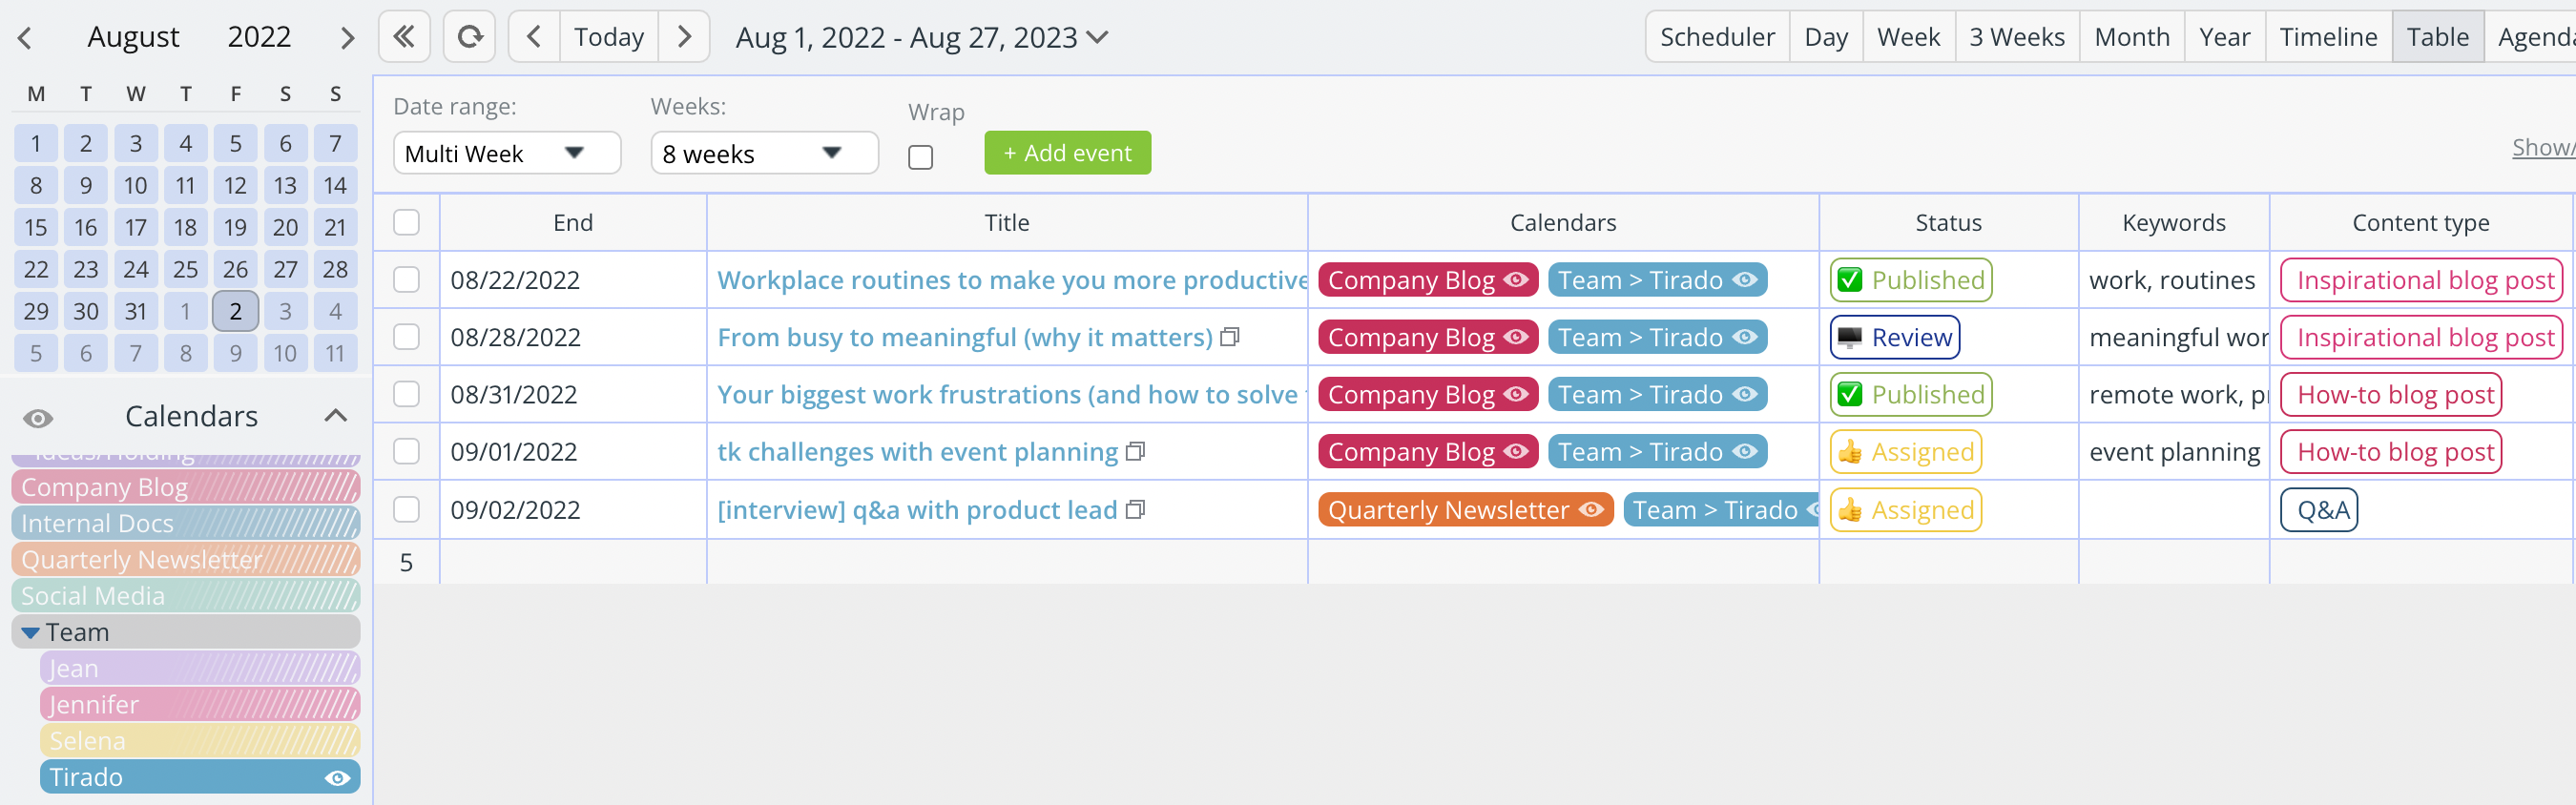
Plus, it’s easy for anyone on the content team to view only their own workload:
Scenario 2: Connect all the dots for a product launch
A product launch involves coordinating many different pieces. You and your team probably rely on a whole collection of apps and tools, and for good reason: they’re extremely good at what they are designed to do. The tricky part is ensuring that everyone on the team can stay updated, share relevant details or changes, and access the information they need when they need it.
That’s where Teamup comes in, and Table view in particular. Check out this use of Table view by a product launch team to keep all the pieces in one place, so anyone can check for updates or access links, docs, or details:
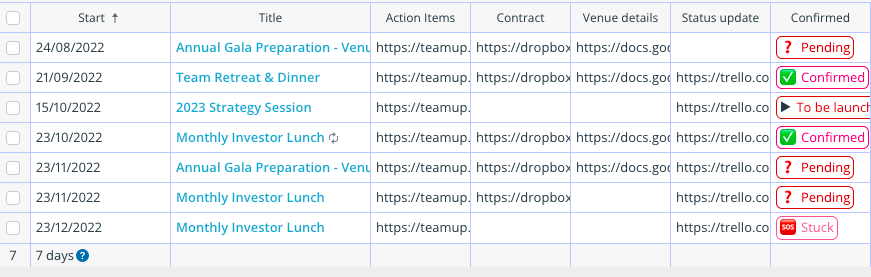
Let’s say you’re working on a tight schedule (and isn’t that always the case with a product launch?). You can sort by priority to ensure the most important items get your attention first. Or, if you have individual sub-calendars for each member of your team, they can view their own assignments in Table view, sorted in the way that’s important.
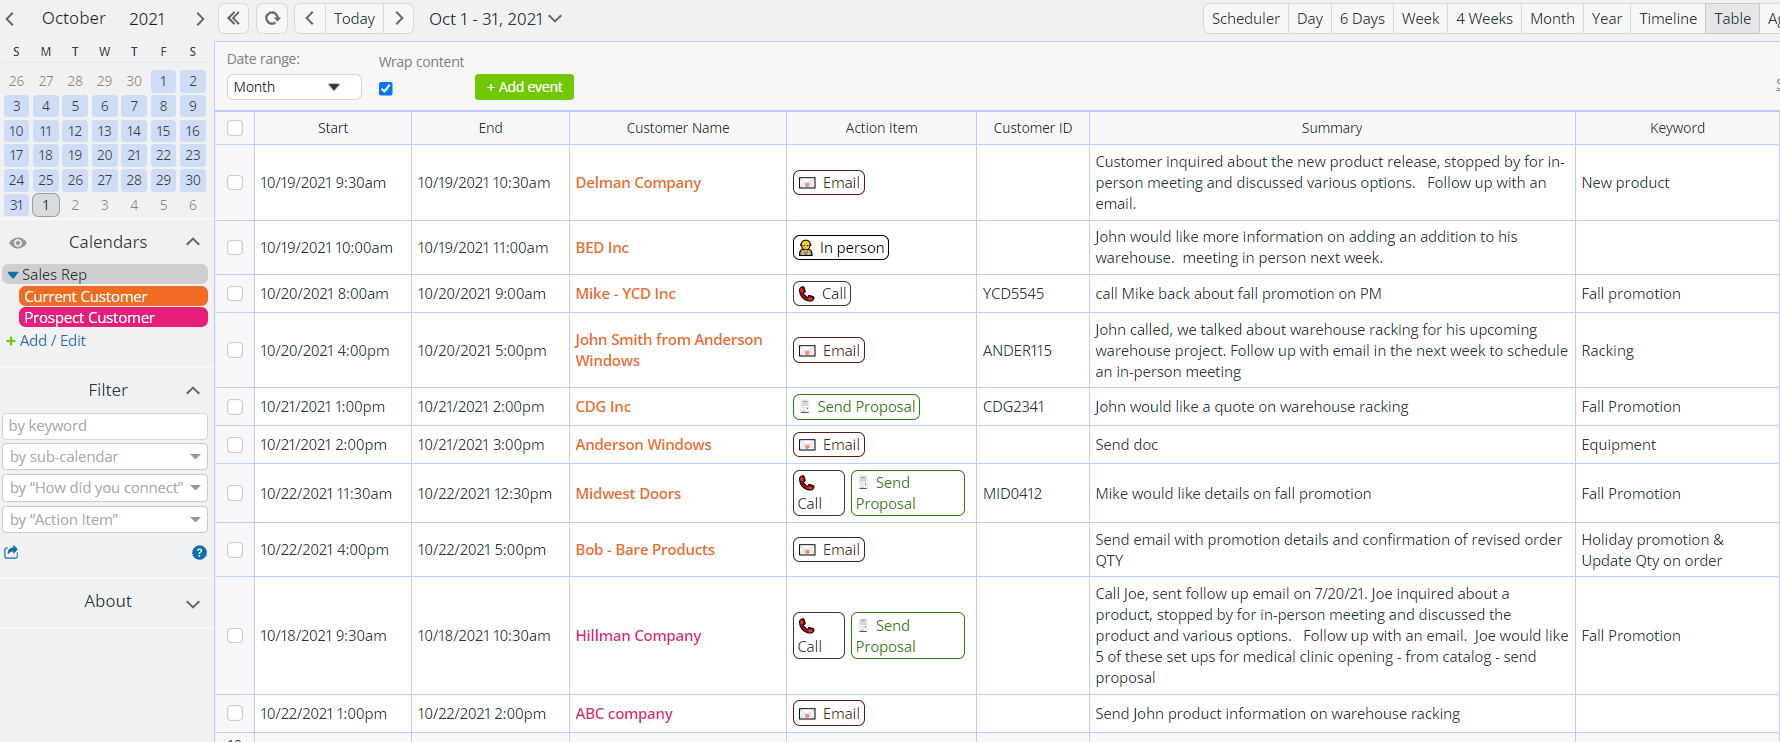
Scenario 3: Track customer info for sales follow-up
If you’re in sales, you know that follow-up is the second most important rule. (The first most important rule, of course, is Always Be Closing). But keeping track of details and what you talked about last time you made the call or sent an email to a particular customer? Unless you’re using a complicated CRM, you’re digging through your call history and email Sent folder to figure it out.
Instead, you can use Teamup to make life easier, not busier. Here’s an example of scanning all the relevant info easily in Table view:
Scenario 4: Stay informed with a clean news ticker calendar
Working with columns also means you can create a cleaner view for your daily use, for meetings and presentations, or to share with others. For example, at Teamup, we collect tips from our support team along with product news in our Teamup Ticker. Then we share a filtered Table view on our News page:
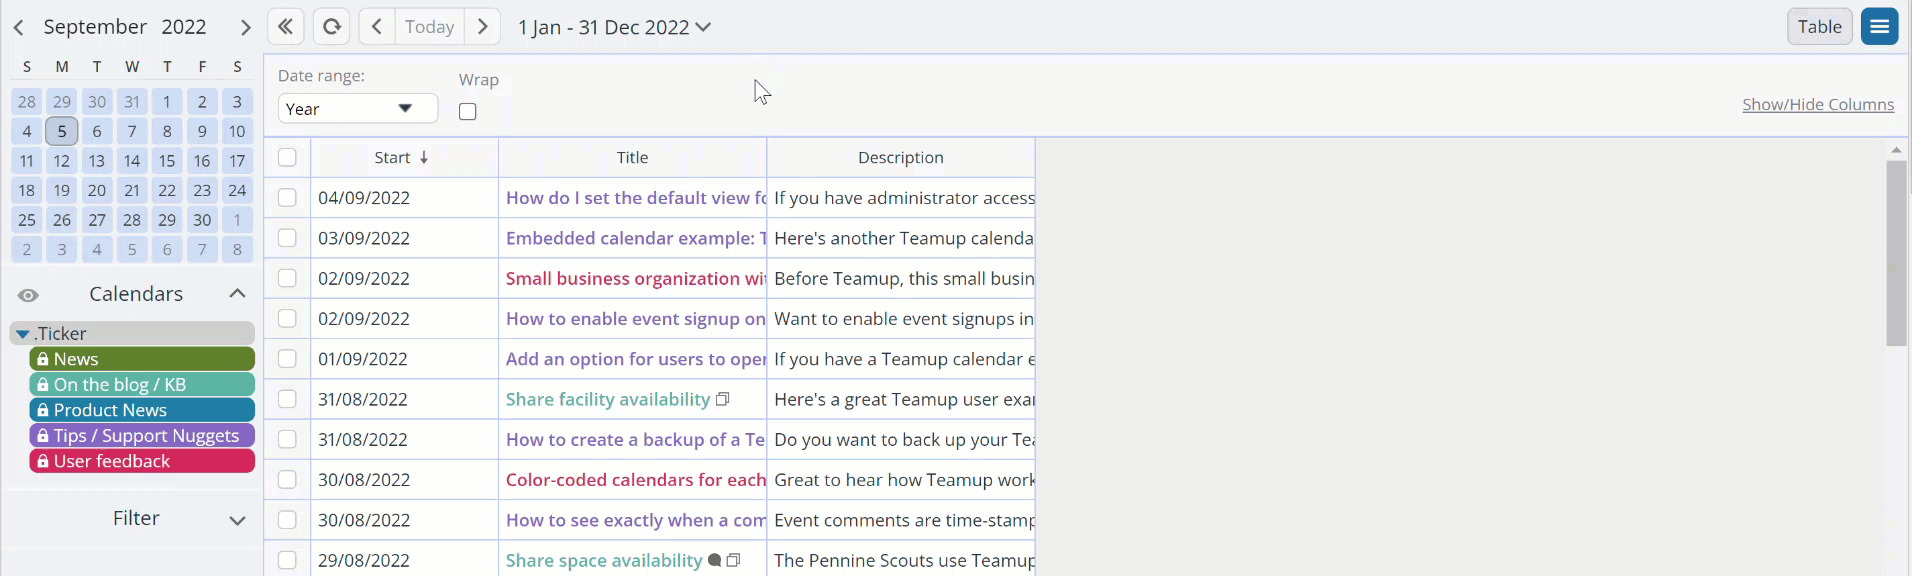
The Teamup News Ticker calendar demonstrates what you can do with columns:
- Hide or show any column.
- Adjust column width.
- Rearrange columns.
- Sort data by one or multiple columns.
- Wrap text in columns.
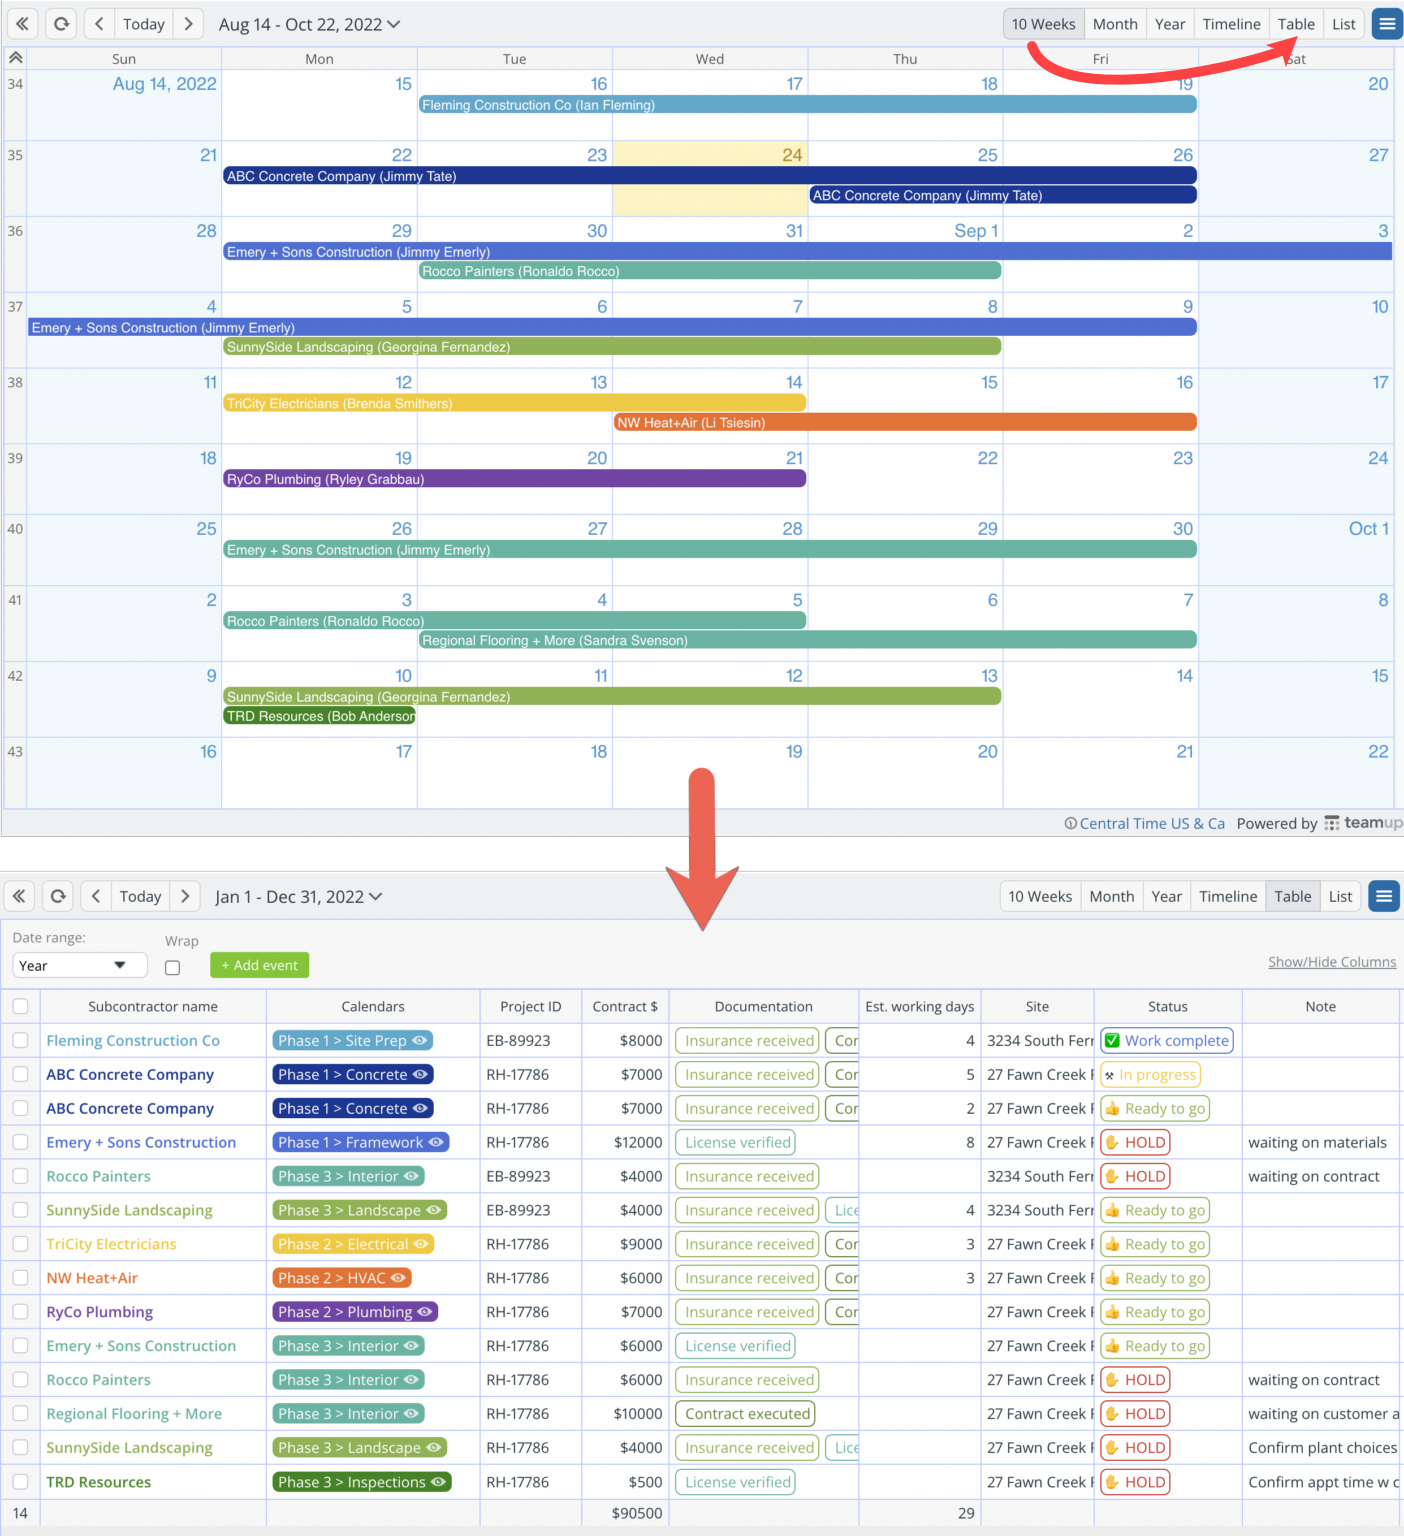
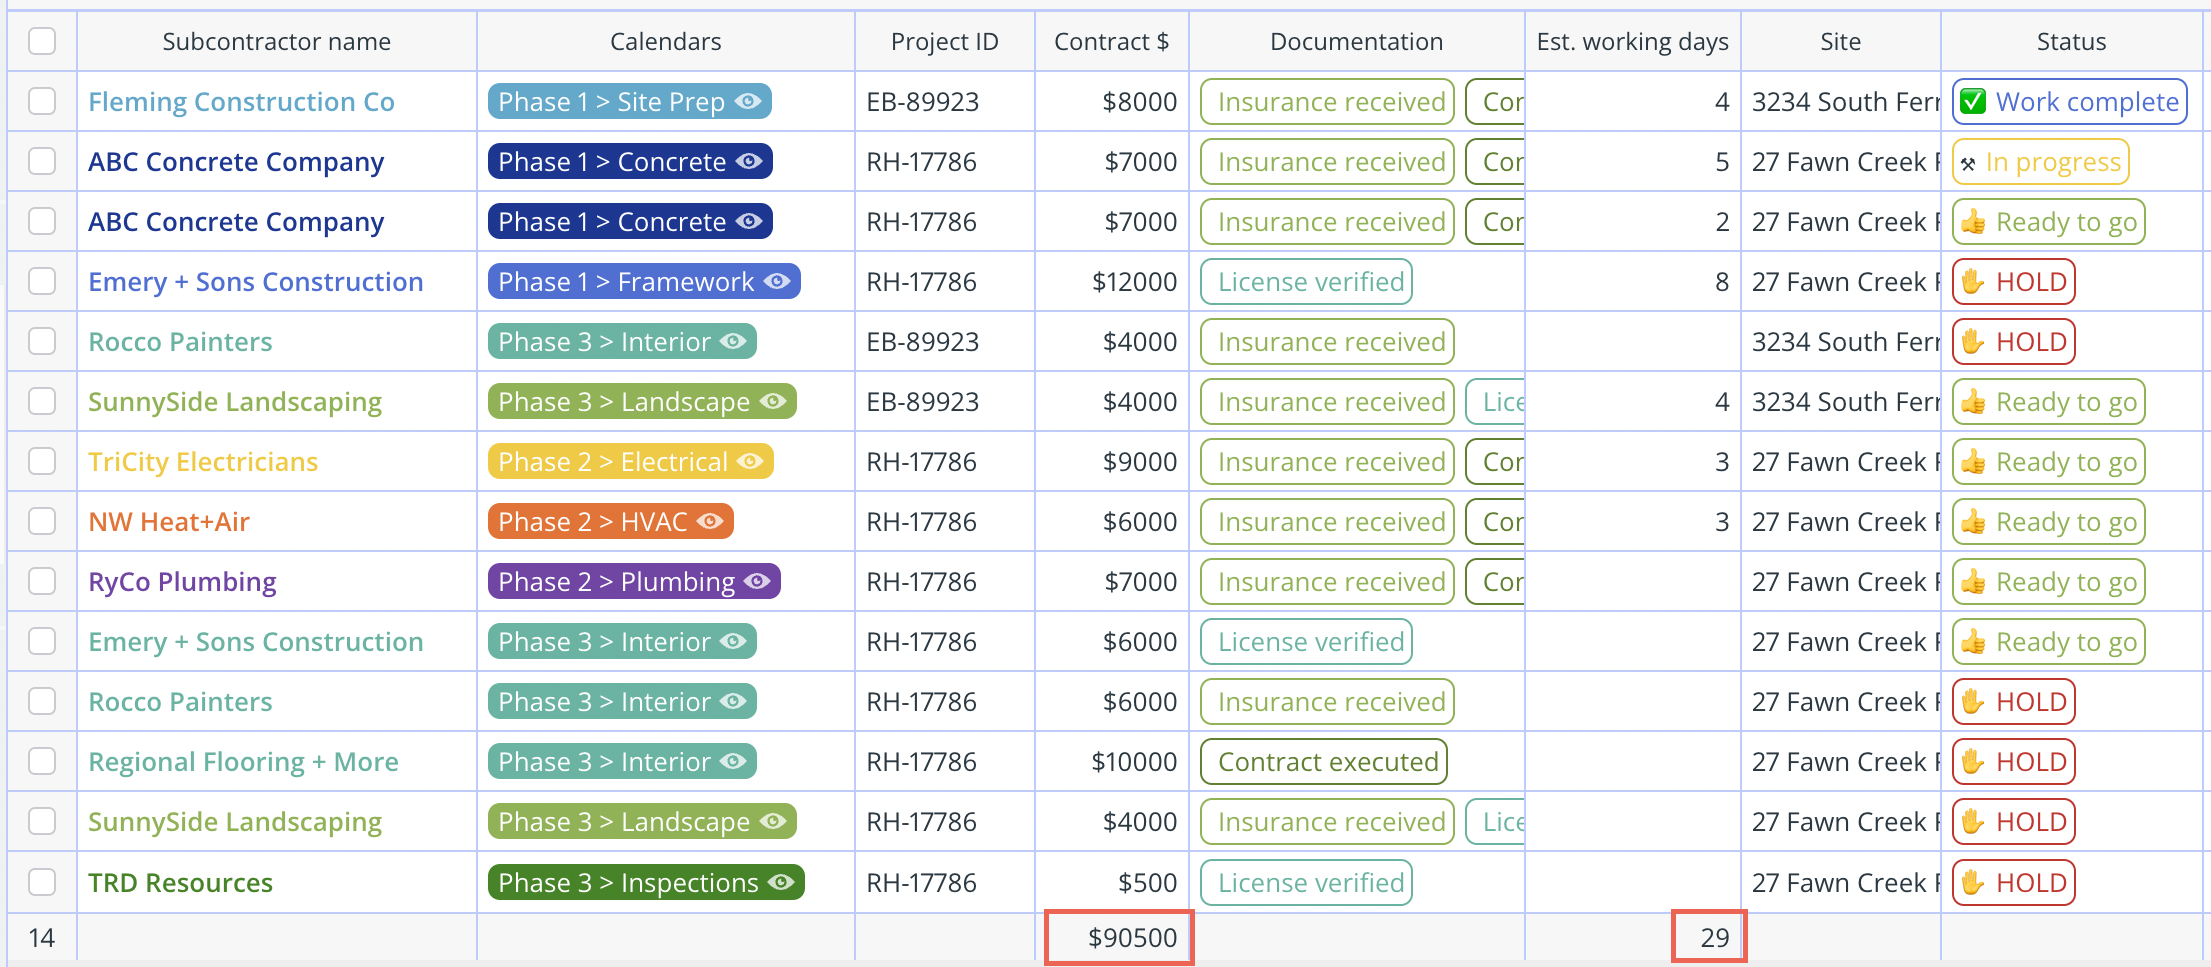
Scenario 5: Calculate totals for subcontractor management
Managing construction projects means working with a variety of subcontractors. As a construction manager, you might need to quickly find info on a particular project in order to schedule work and keep the project on schedule.
To do so, you need to see which subcontractors have a fully executed contract and all needed materials (a “Ready to go”) status:
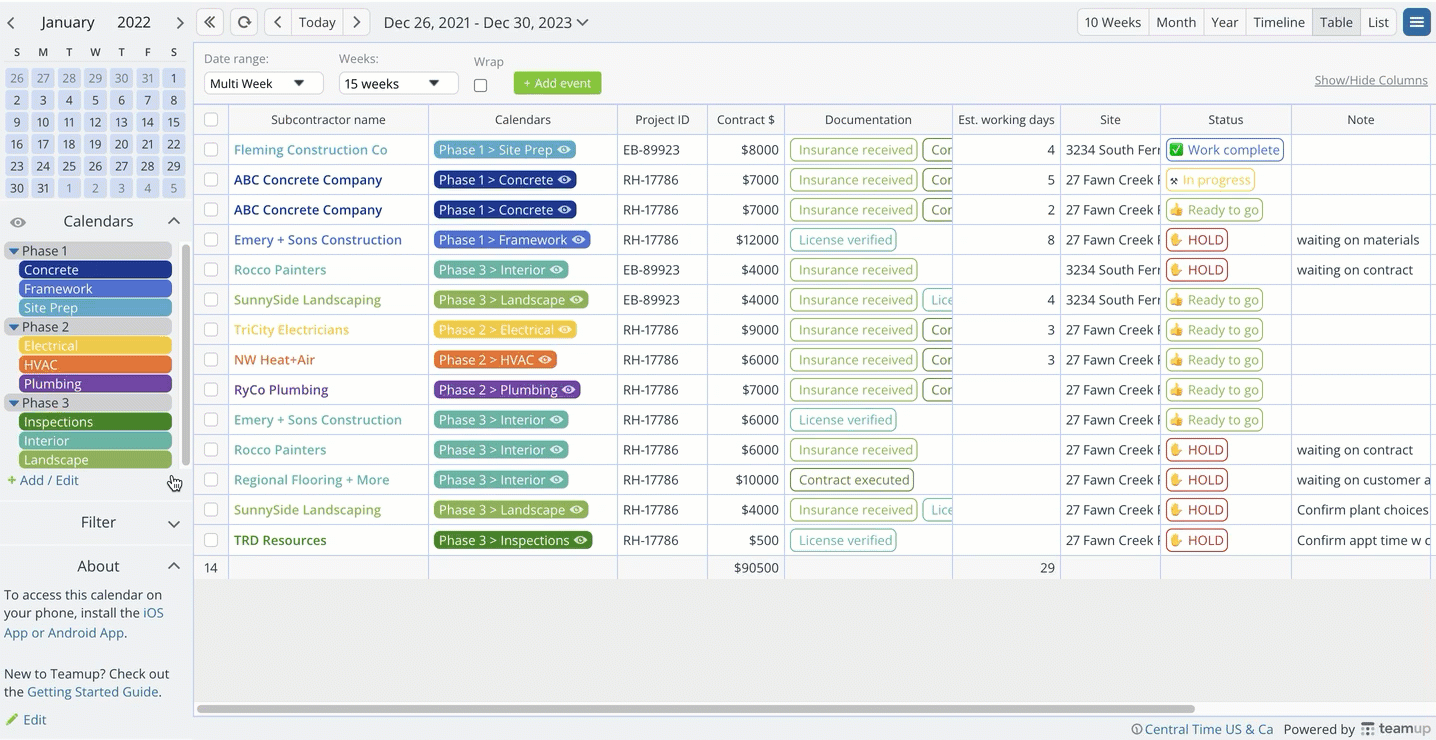
You can also quickly see the sum of any number field, such as contract amounts. Need to know the total contract value for a certain subcontractor? Filter by the appropriate name. A couple of clicks lets you see the total cost of all subcontractors on a project, or by project phase.
Ready to try it out for yourself? Head over to a live demo of Table view, with all features enabled. Take it for a test run and see for yourself. With a calendar this versatile and powerful, you might be able to free yourself from the spreadsheet.
We’d love to hear your thoughts. Find us on Twitter (@teamupcalendar)!