
Last updated Sep 20, 2022
As a sales rep, you have to generate reports frequently. It takes time to get the right data for each report. Even simple reports may require you to jump through multiple forms and data sets to pull just the information you need. You need a way to sort data so you have the needed inputs to generate a quick sales report.
Because there are customers waiting.
There’s more important work to do. Meetings and follow-ups. Customer calls and product demos. But getting paid usually depends on getting those reports done. You may also want to see reports for your own purposes, such as tracking client trends, diving into customer history, viewing sales over time, etc. Those reports are specific to your individual priorities, which may change over time. So even if you have processes for your standard reports, generating those other unique reports takes more time.
"It takes too long to generate the reports I have to turn in, and I'm neglecting other more important work–like talking to my customers!" Share on XA quick sales report starts with good data capture
A good information system makes it easy to generate the reports you need. It starts with how you capture information: all in one place, and tag and track context.
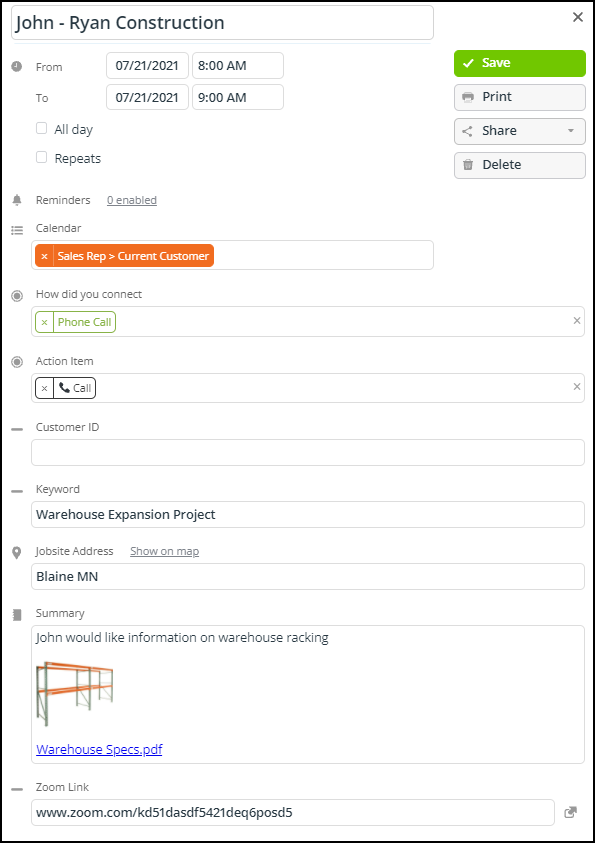
Then you can easily filter and sort the data you need, for precise reporting or visual perspective, over the appropriate time period. With context tags, you can pull information by context and see the relevant details.
Sort data for relevant reports
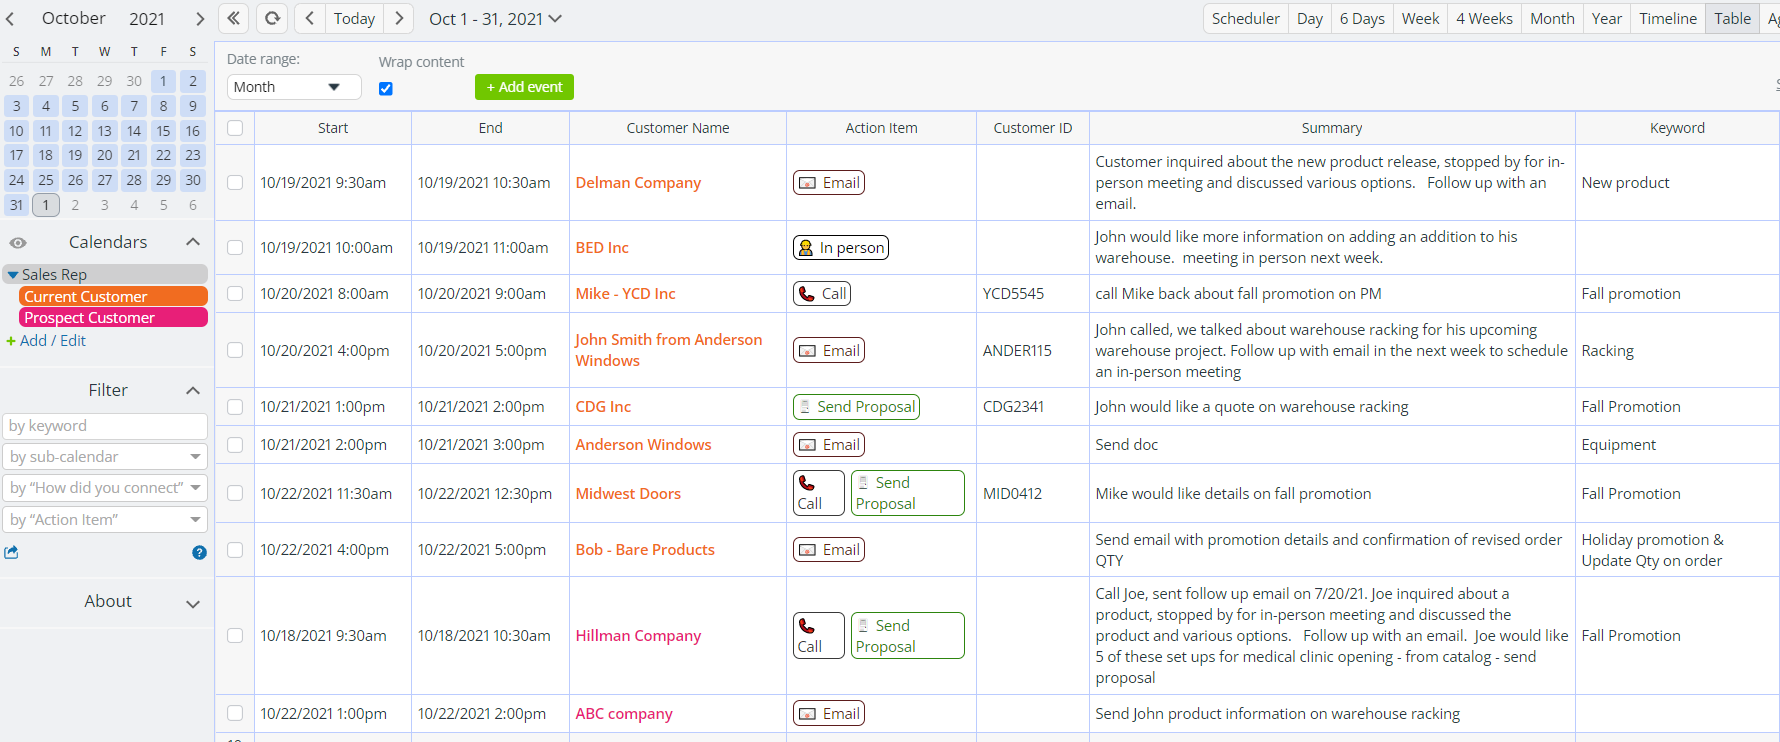
Here’s an example of this type of data filtering and custom views in Teamup.
- Set up the simplest possible process for pulling the necessary data for the reports you use often.
- The more you can customize and filter the data you collect, the more useful it will be.
How does it work with Teamup?
- Use a keyword in a custom field as context when you capture the info.
- When it’s time to generate the report, use Table view. Hide columns as needed, and sort by context field to see the data that matters.
- Use your preferred tool to create the report with the input from your calendar. If all you need is on your calendar screen, print or export a PDF in a few clicks.